
core score measuring wellbeing
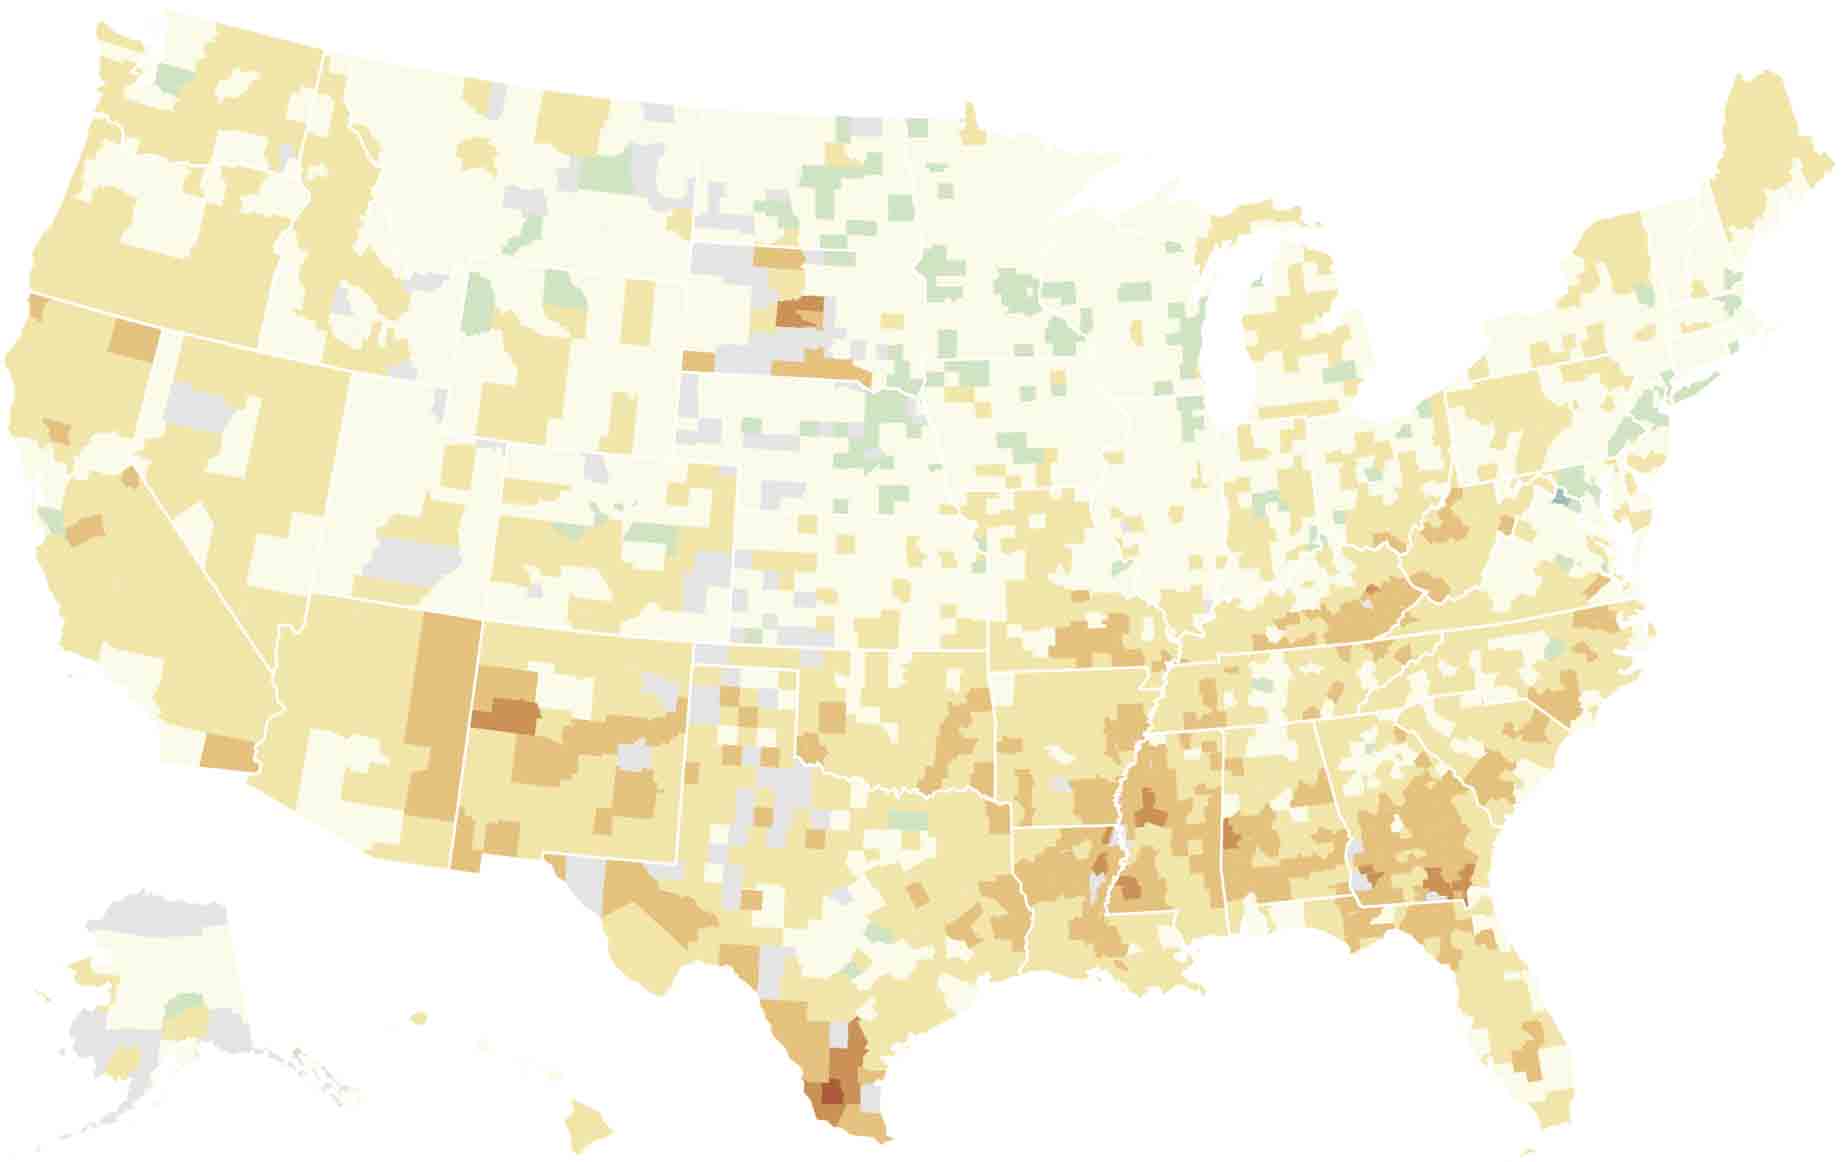
A project of the American Political Economy Exchange (APEX) at the Institution for Social and Policy Studies at Yale University, the CORE Score is a measurement of American wellbeing. While typical economic indicators measure growth, the Score offers a people-focused look at the state of the nation. The Score is drawn from 11 indicators across four categories. It was launched as a project of the Commission on Reimagining Our Economy (CORE) at the American Academy of Arts and Sciences. Scroll down to view CORE Scores by county, how Scores have changed over time, and Scores by income, race/ethnicity, age, gender, and education.


'%3e%3cpath%20d='M18.6666%202.23357C18.446%201.41781%2017.8097%200.779022%2016.9939%200.56084C15.8982%200.13781%205.28481%20-0.0694631%202.20602%200.572961C1.39026%200.793567%200.751475%201.42993%200.533293%202.24569C0.0387476%204.41539%200.00117186%209.1063%200.545414%2011.3245C0.76602%2012.1402%201.40239%2012.7791%202.21814%2012.9972C4.38784%2013.4966%2014.703%2013.5669%2017.006%2012.9972C17.8218%2012.7766%2018.4606%2012.1402%2018.6788%2011.3245C19.206%208.9608%2019.2436%204.56084%2018.6666%202.23357Z'%20fill='white'/%3e%3cpath%20d='M12.727%206.77875L7.78159%203.94238V9.61512L12.727%206.77875Z'%20fill='%2300366B'/%3e%3c/g%3e%3cdefs%3e%3cclipPath%20id='clip0_2047_3661'%3e%3crect%20width='20'%20height='13.3333'%20fill='white'%20transform='translate(0%200.112305)'/%3e%3c/clipPath%3e%3c/defs%3e%3c/svg%3e)